Organizations today are swamped with a flood of data from various sources, resulting in complications. Analytics tools have evolved into an essential aid in transforming raw data into valuable insights. These tools, especially those endowed with added artificial intelligence capabilities, are potent assets in interpreting data, recognizing patterns, and making decisions. Their visualization AI principles play an important role in turning exceedingly complicated data into relevant data that can be used by any stakeholder in the organization.
Importance of AI Data Visualization in Data Analytics
Data visualization connects raw data with concrete insights, making complex datasets easily digestible through visual representation. AI for data visualization is much more capable as it recognizes patterns and anomalies automatically, something that might slip the eyes of human analysts. AI visualization in supply chain management may instantly identify areas of inefficiency and bottlenecks by examining multiple factors at the same time. Furthermore, the tools can also represent trends and risk areas in real time, allowing for swift decision-making.
Consider a scenario in the healthcare sector where analysis of a large number of patient records is required. Using the traditional approach for pattern recognition will take weeks, but AI visualization tools can instantly create interactive heat maps with disease prevalence patterns or patient outcome correlations. Thus, this instant visual representation helps medical providers make quick and effective decisions.
Key Visualization Features to Consider in Analytics Tools
When looking for the best AI data analytics tools for data analysis, consider the following key visualization features:
Interactive Dashboards
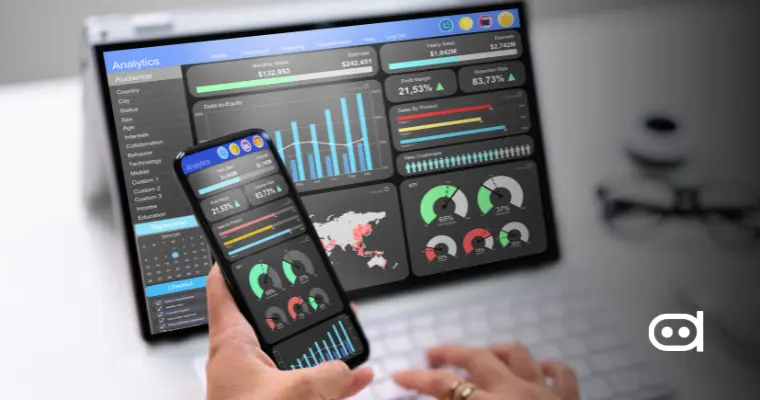
Interactive dashboards represent the command center of modern data analytics and AI data visualization tools. They serve as the primary interface between users and their data, enabling them to explore, analyze, and derive insights efficiently. The most effective dashboards adapt to user behavior over time, learning from interactions and providing more relevant visualizations and insights. Dashboards that combine intuitive design and robust features can significantly accelerate the analytical process, allowing analysts to communicate findings rather than manipulate data.
- Drill-down capabilities for exploring hierarchical data
- Customizable widgets and layouts
- Dynamic filtering options
- User-specific views based on roles and responsibilities
- Touch-enabled mobile device interactions
Real-Time Visualization
In today’s fast-paced business environment, instant decision-making has made real-time visualization increasingly critical. Modern systems must collect, process, and visualize data streams from various sources simultaneously and make that accessible for immediate insights and accuracy of data. Effective real-time visualization can significantly impact problem-solving and crisis management. This capability is, therefore, key in industry segments such as manufacturing, where difficulties along production lines require immediate action, or in financial trading, where snap decisions can mean the difference between a substantial win or a worrying loss.
- Live data streaming with ultra-low latency
- Automatic refresh
- Historical comparison
- Detection of anomalies and alerts
Advanced Charting Options
Advanced charting capabilities create powerful data narratives that go beyond basic visualization. Any modern data visualization AI tool must offer a comprehensive suite of visualization options that are adaptable to various data types and analytical needs. When dealing with complicated datasets, choosing the right chart type might mean the difference between confusion and clarity. Organizations should look for tools that provide various chart types and guide users in selecting the most appropriate visualization for their specific data and audience.
- Traditional charts (line, bar, pie) with advanced customization
- Geospatial mapping capabilities
- Network and relationship graphs
- Sankey diagrams for flow visualization
- Treemaps for hierarchical data representation
- Custom visualization templates for industry-specific needs
Predictive and Prescriptive Analytics Visualization
Visualization of predictive and prescriptive analytics is one of the most advanced features of modern analytics tools. These features help organizations not only understand what might happen but also visualize the potential outcomes of different decisions. Stakeholder buy-in and decision-making confidence rely heavily on the capacity to effectively communicate complex statistical models and their predictions visually. This is especially beneficial when addressing the probability distributions of multiple scenarios.
- Forecast visualization
- What-if scenario modeling
- Risk assessment matrices
- Decision trees with probability distributions
- Optimization results with multiple variables
AI-Driven Insights Representation
AI-driven insight representation improves how businesses identify and express trends in their data. These tools use complex algorithms to automatically identify significant patterns, correlations, and anomalies, a task that would take weeks for human analysts. The most popular tools today combine advanced AI capabilities with intuitive forms of visualization, making complicated findings accessible to all stakeholders.
- Automated pattern discovery and representation
- Natural language generation for insight descriptions
- Anomaly visualizations with contextual explanations
- Correlation-based analysis and visualization
- Extended trend analysis with automated commentary
Integration with Other Tools
The level of tool integration affects how well it will fit into an organization’s existing technology framework. The most powerful tools allow you to connect seamlessly to all of the numerous data sources and business applications accessible, while maintaining data integrity and performance. This integration should be bi-directional, allowing for input and output in a variety of formats as well as real-time updates across systems. The ability to embed visualizations in different apps and web platforms expands their usefulness across the organization.
- API connectivity with popular data sources
- Export functionality in varying formats
- Embedding options for web applications
- Integration with BI platforms
- Support for standard data storage systems
Security and Compliance
Security and compliance elements are not add-ons but are, in fact, core functions within modern AI tools for data visualization. Regulatory needs and events like data threats have put organizations on the lookout for tools that could provide robust security without compromising functionality. Such tools come with elaborate access control mechanisms, complete audit trails, and assure compliance with several industry standards.
- Role-based access control
- Data encryption in transit and at rest
- Audit trails for visualization access
- Conformance with industry standards (GDPR, HIPAA, and more)
- Secure mechanisms for sharing
Future Trends in AI Data Visualization
Choose the right AI data analytics tool for your business to stay current with all future developments and keep ahead of the competition. Current trends in AI data visualization are rapidly growing in a variety of directions. Here’s what you can expect from the future of data visualization:
- AR Integration: The new visualization tools will begin to incorporate VR augmented reality to assist users in working with data on a three-dimensional scale.
- Voice-Activated Manipulations: In voice-controlled visualization manipulation, natural language processing allows for much more natural data exploration.
- Automated Insight Generation: AI algorithms are maturing, automating the process of generating and visualizing relevant insights without any human intervention.
- Edge Computer Integration: Visualization tools are adapting themselves to process and visualize data, thereby reducing latency and improving real-time capability.
- Collaborative Visualization: Space is opening for enhanced exploration and analysis of data within a team setting so that several users can show, on the same computer screen, their interaction with visualizations.
Wrapping Up
In order to make effective, data-informed decisions, it is crucial for organizations to select the appropriate visualization tools from the AI data analytics suite. The right tool should pair sophisticated AI capabilities with user-friendly interfaces, making complex data analytics accessible to everyone. As new technology emerges, organizations must closely monitor visualization capabilities to select tools that meet both current needs and future demands.
Organizations should evaluate visualization features based on their use cases, users’ technical backgrounds, and data complexity, and then select a scalable platform. The right set of features for data visualization using AI will bring ease to the process of data analytics so that even a non-technical user can fetch meaningful insights from the data analyses.


